Website Performance Analysis in 1 Minute: Easy Guide (2024)
Is your website getting fewer visitors, more people leaving quickly, and not enough sales or sign-ups?
You should check how well your website is performing. This guide will show you the quickest and simplest way to test your site’s speed using Google PageSpeed Insights.
You’ll learn how to understand your results and what to do to fix any problems.
Conduct a test in Google PageSpeed Insights:
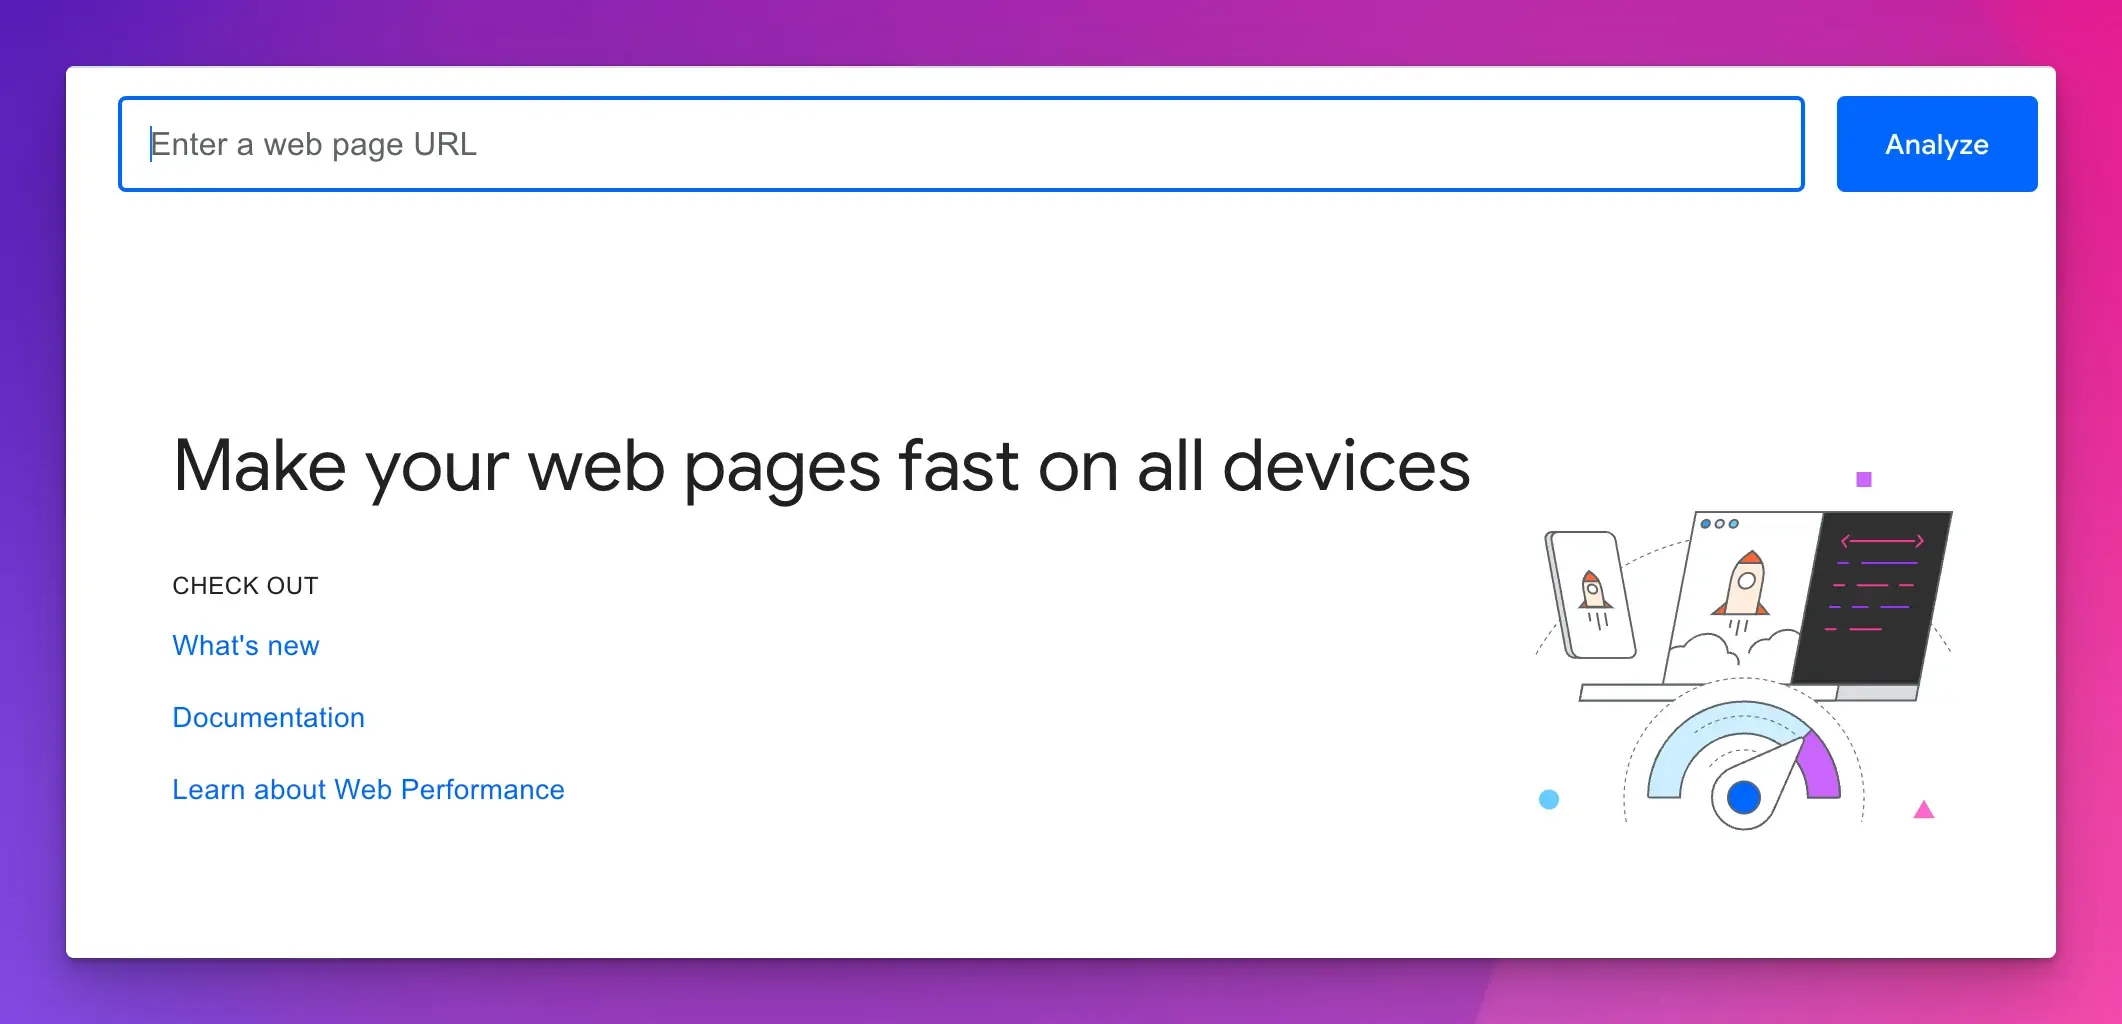
It is an easy task to perform a website audit using the PSI tool:
- Visit the PageSpeed Insights website.
- Copy/Paste the URL of the webpage you want to test.
- Click the “Analyze” button.
- Wait for the tool to gather data from the CrUX database and the Lighthouse API.
If the result is not green and shows bad results for your business website, we can help you increase your website’s performance and get a green score on mobile and desktop. You can hire us to optimize your website performance report .

CrUX: The Chrome User Experience Report (CrUX) database offers insights into how real-world users experience websites.
Note: When your PSI report doesn’t load, refresh the page or check for server and other technical problems.
After a short while, you’ll receive a detailed analysis of your website performance, including an overall score and specific recommendations for improvement. If you’re unsure how to interpret the results or want to learn more about Google PageSpeed Insights, keep reading.
What is Google PageSpeed Insights (PSI)?
Google PageSpeed Insights (PSI) is a free tool that analyzes the speed and performance of a specific webpage on both mobile and desktop devices.
It provides an overall performance score and detailed insights into various aspects of page performance, helping you identify areas for improvement.
PSI uses both lab data (synthetic data) and field data (real-world data) to provide a comprehensive analysis.
Key Features of PSI:
- Performance Score: An overall score that summarizes the page’s speed and performance.
- Core Web Vitals: Key metrics that matter most for user experience.
- Opportunities and Diagnostics: Detailed suggestions and warnings for improving page speed and performance.
Importance of PageSpeed Insights for Business Websites:
Slow websites cost owners $2.6 billion in losses each year.
On average, a website takes 10.5 seconds to load, but visitors usually leave if it takes more than 2 seconds. This delay causes problems for 61% of sites worldwide.
Recent studies show that faster page speeds can greatly boost conversion rates.
Google PageSpeed Insights helps you find what’s slowing down your site and improve it based on Google’s best practices.
Key Benefits:
- Increase Conversions: Faster loading times can significantly boost conversion rates.
- Improved User Experience: A smoother, quicker browsing experience keeps users engaged.
- Better SEO: Google prioritizes fast-loading sites in search rankings, helping you attract more organic traffic.
Why should you consider Google Page Speed Score?
Your PageSpeed Insights report highlights your site’s strengths and weaknesses.
A low PSI score means there are technical problems that could cost you money and visitors.
But aiming for a perfect score isn’t necessary. Instead, prioritize improving user experience, quality content, and relevance.
4 Factors of Page Speed Score:
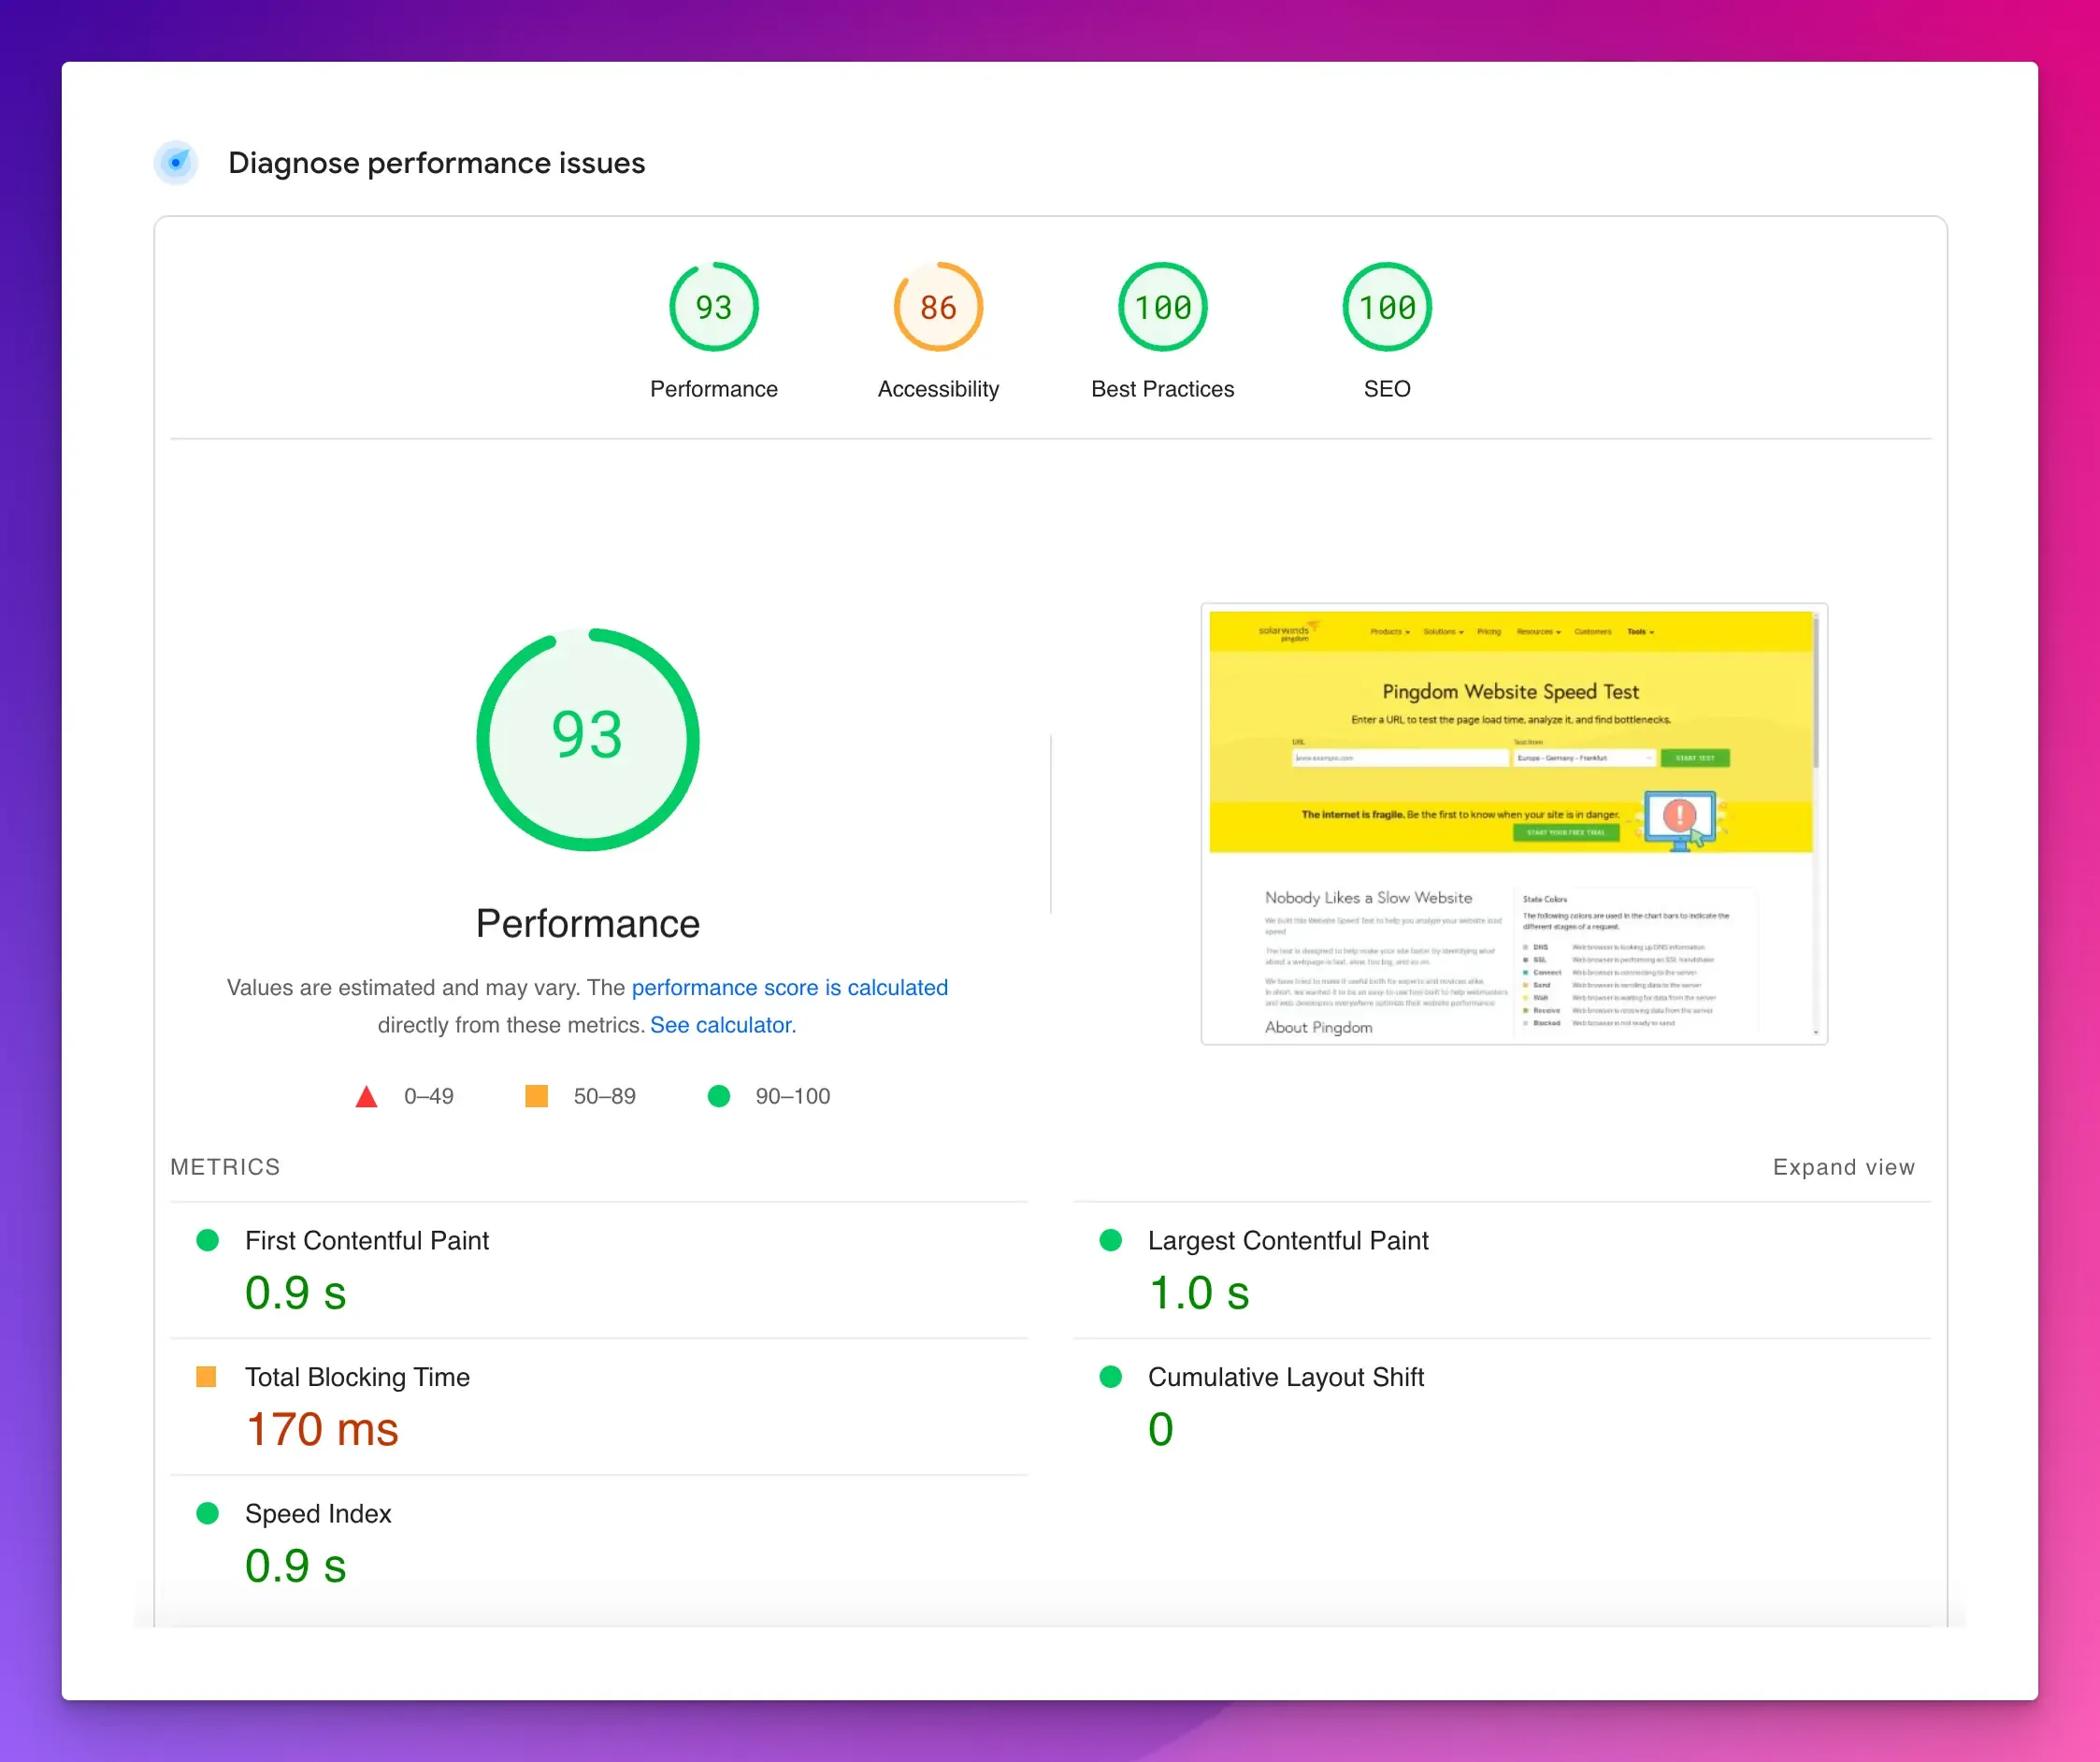
When you run a PageSpeed test, you get four different types of scores:
- Performance
- Accessibility
- Best Practices
- SEO
The Performance score is prioritized and is an average of several metric scores:
- First Contentful Paint (FCP): Time taken for the first piece of content to appear.
- Speed Index: How quickly content is visually displayed.
- Total Blocking Time (TBT): Time during which user input is blocked.
- Largest Contentful Paint (LCP): Time taken for the largest content element to appear.
- Cumulative Layout Shift (CLS): Visual stability of the page.
These metrics are combined into an overall Performance Score, which is visually represented in a tri-color system:
- Green (Good)
- Yellow (Needs Improvement)
- Red (Poor)
Note: Scores are based on lab data from Lighthouse and are weighted by the Lighthouse calculator.
Quick Concept:
Lab Data, also called synthetic data, shows how predefined users might interact with your website. It’s gathered in a controlled setting using the open-source tool Lighthouse.
Toggle between Mobile and Desktop Report:
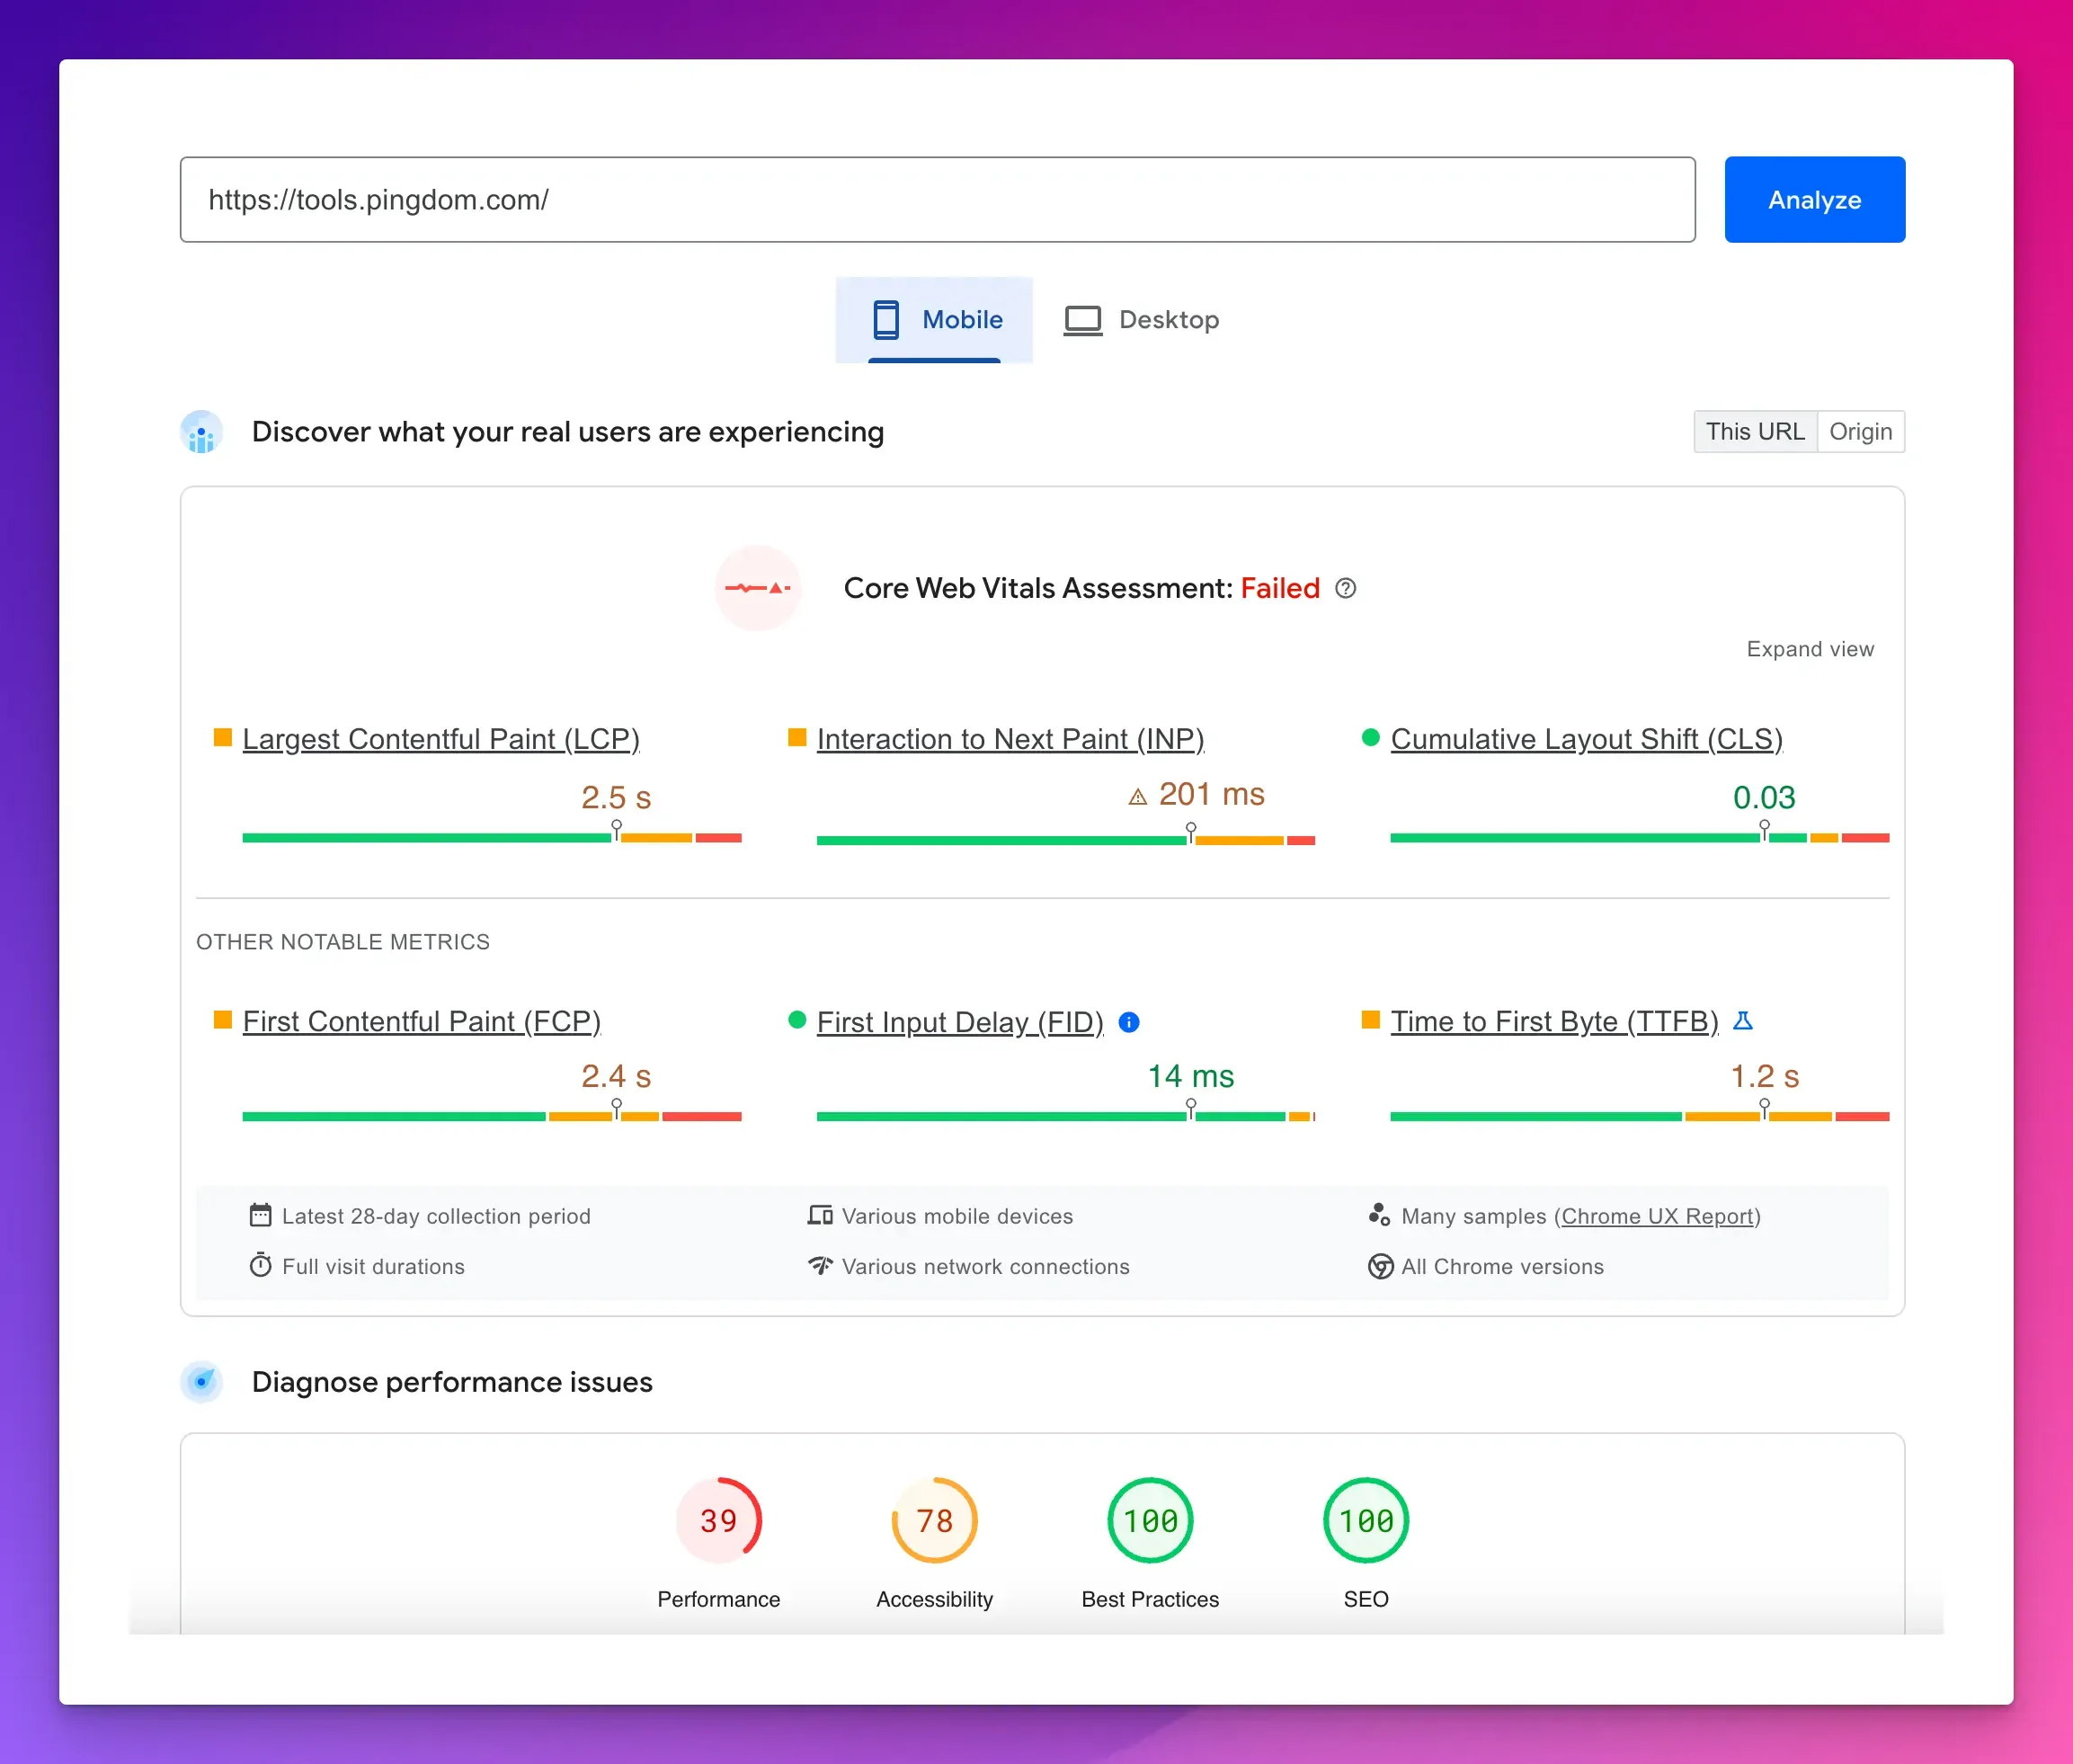
At the top of your PSI report, you can toggle between your webpage’s mobile and desktop versions.
By default, you’ll see the mobile view first.
It’s common for the mobile score to be lower because mobile devices often have slower processors, and certain CSS rules affect mobile performance differently.
It helps you understand how your site performs on various devices.
Core Web Vitals Assessment
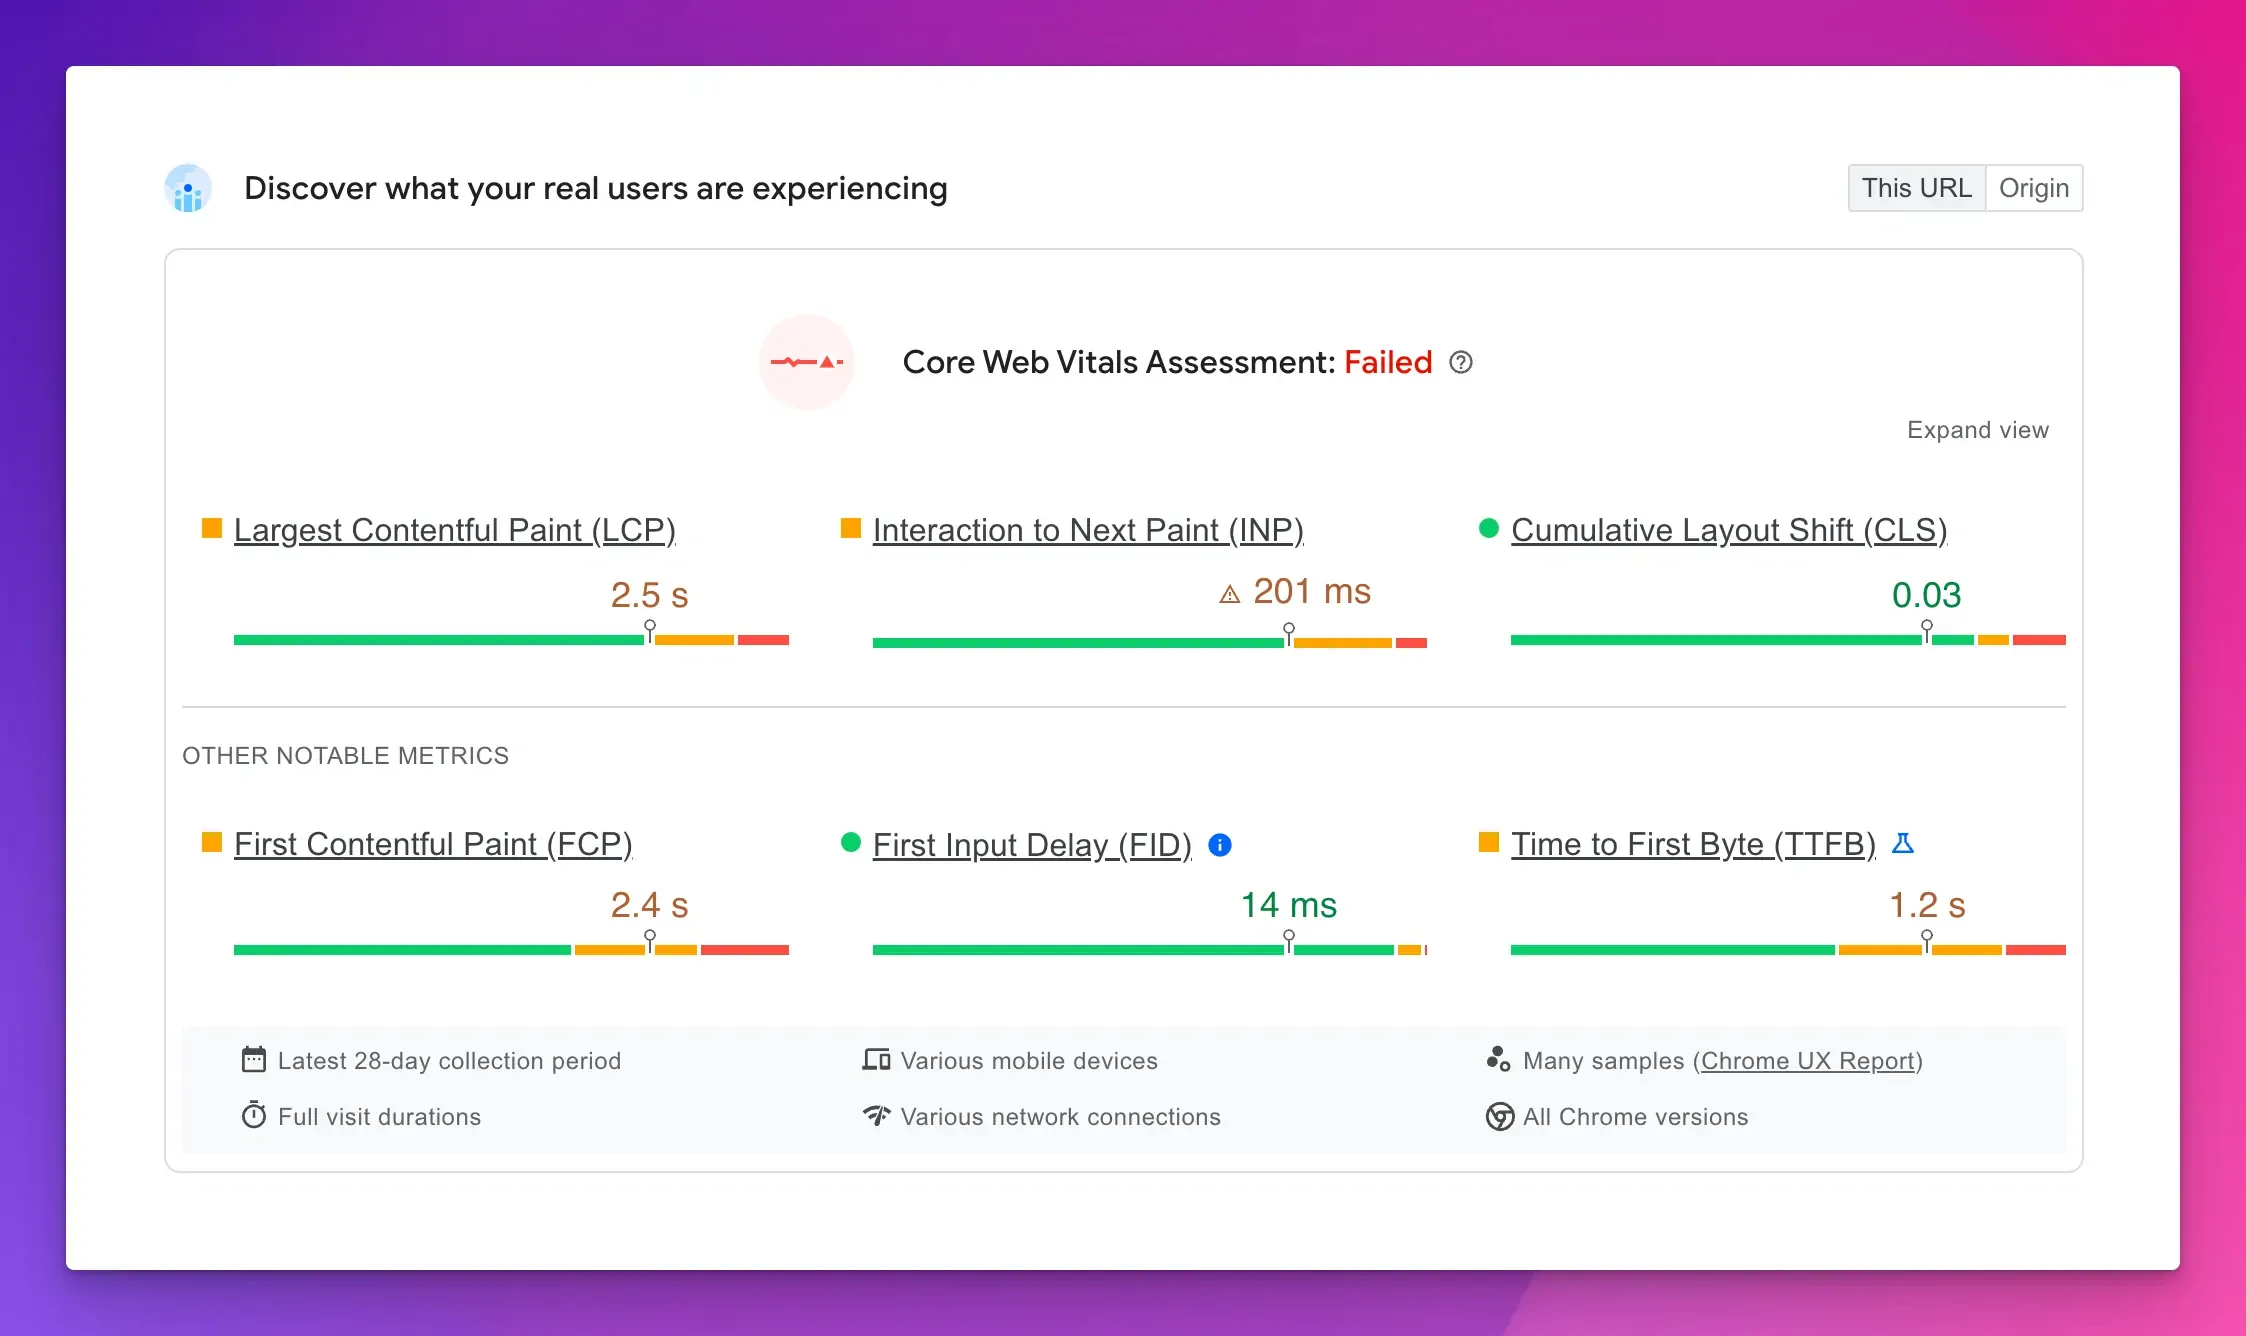
Core Web Vitals are a set of metrics defined by Google that measure the user experience on a website.
These metrics focus on three main aspects: loading, interactivity, and visual stability.
Let’s break down each of these components:
Loading: Largest Contentful Paint (LCP)
- What it measures: The time taken for the largest content element on the page to become visible within the viewport.
- Good threshold: Less than 2.5 seconds.
Interactivity: First Input Delay (FID)
- What it measures: The time from when a user first interacts with your site to when the browser responds to that interaction.
- Good threshold: Less than 100 milliseconds.
Visual Stability: Cumulative Layout Shift (CLS)
- What it measures: The total of all individual layout shift scores for every unexpected layout shift that occurs during the entire lifespan of the page.
- Good threshold: Less than 0.1.
Other Performance Warnings in Google PSI:
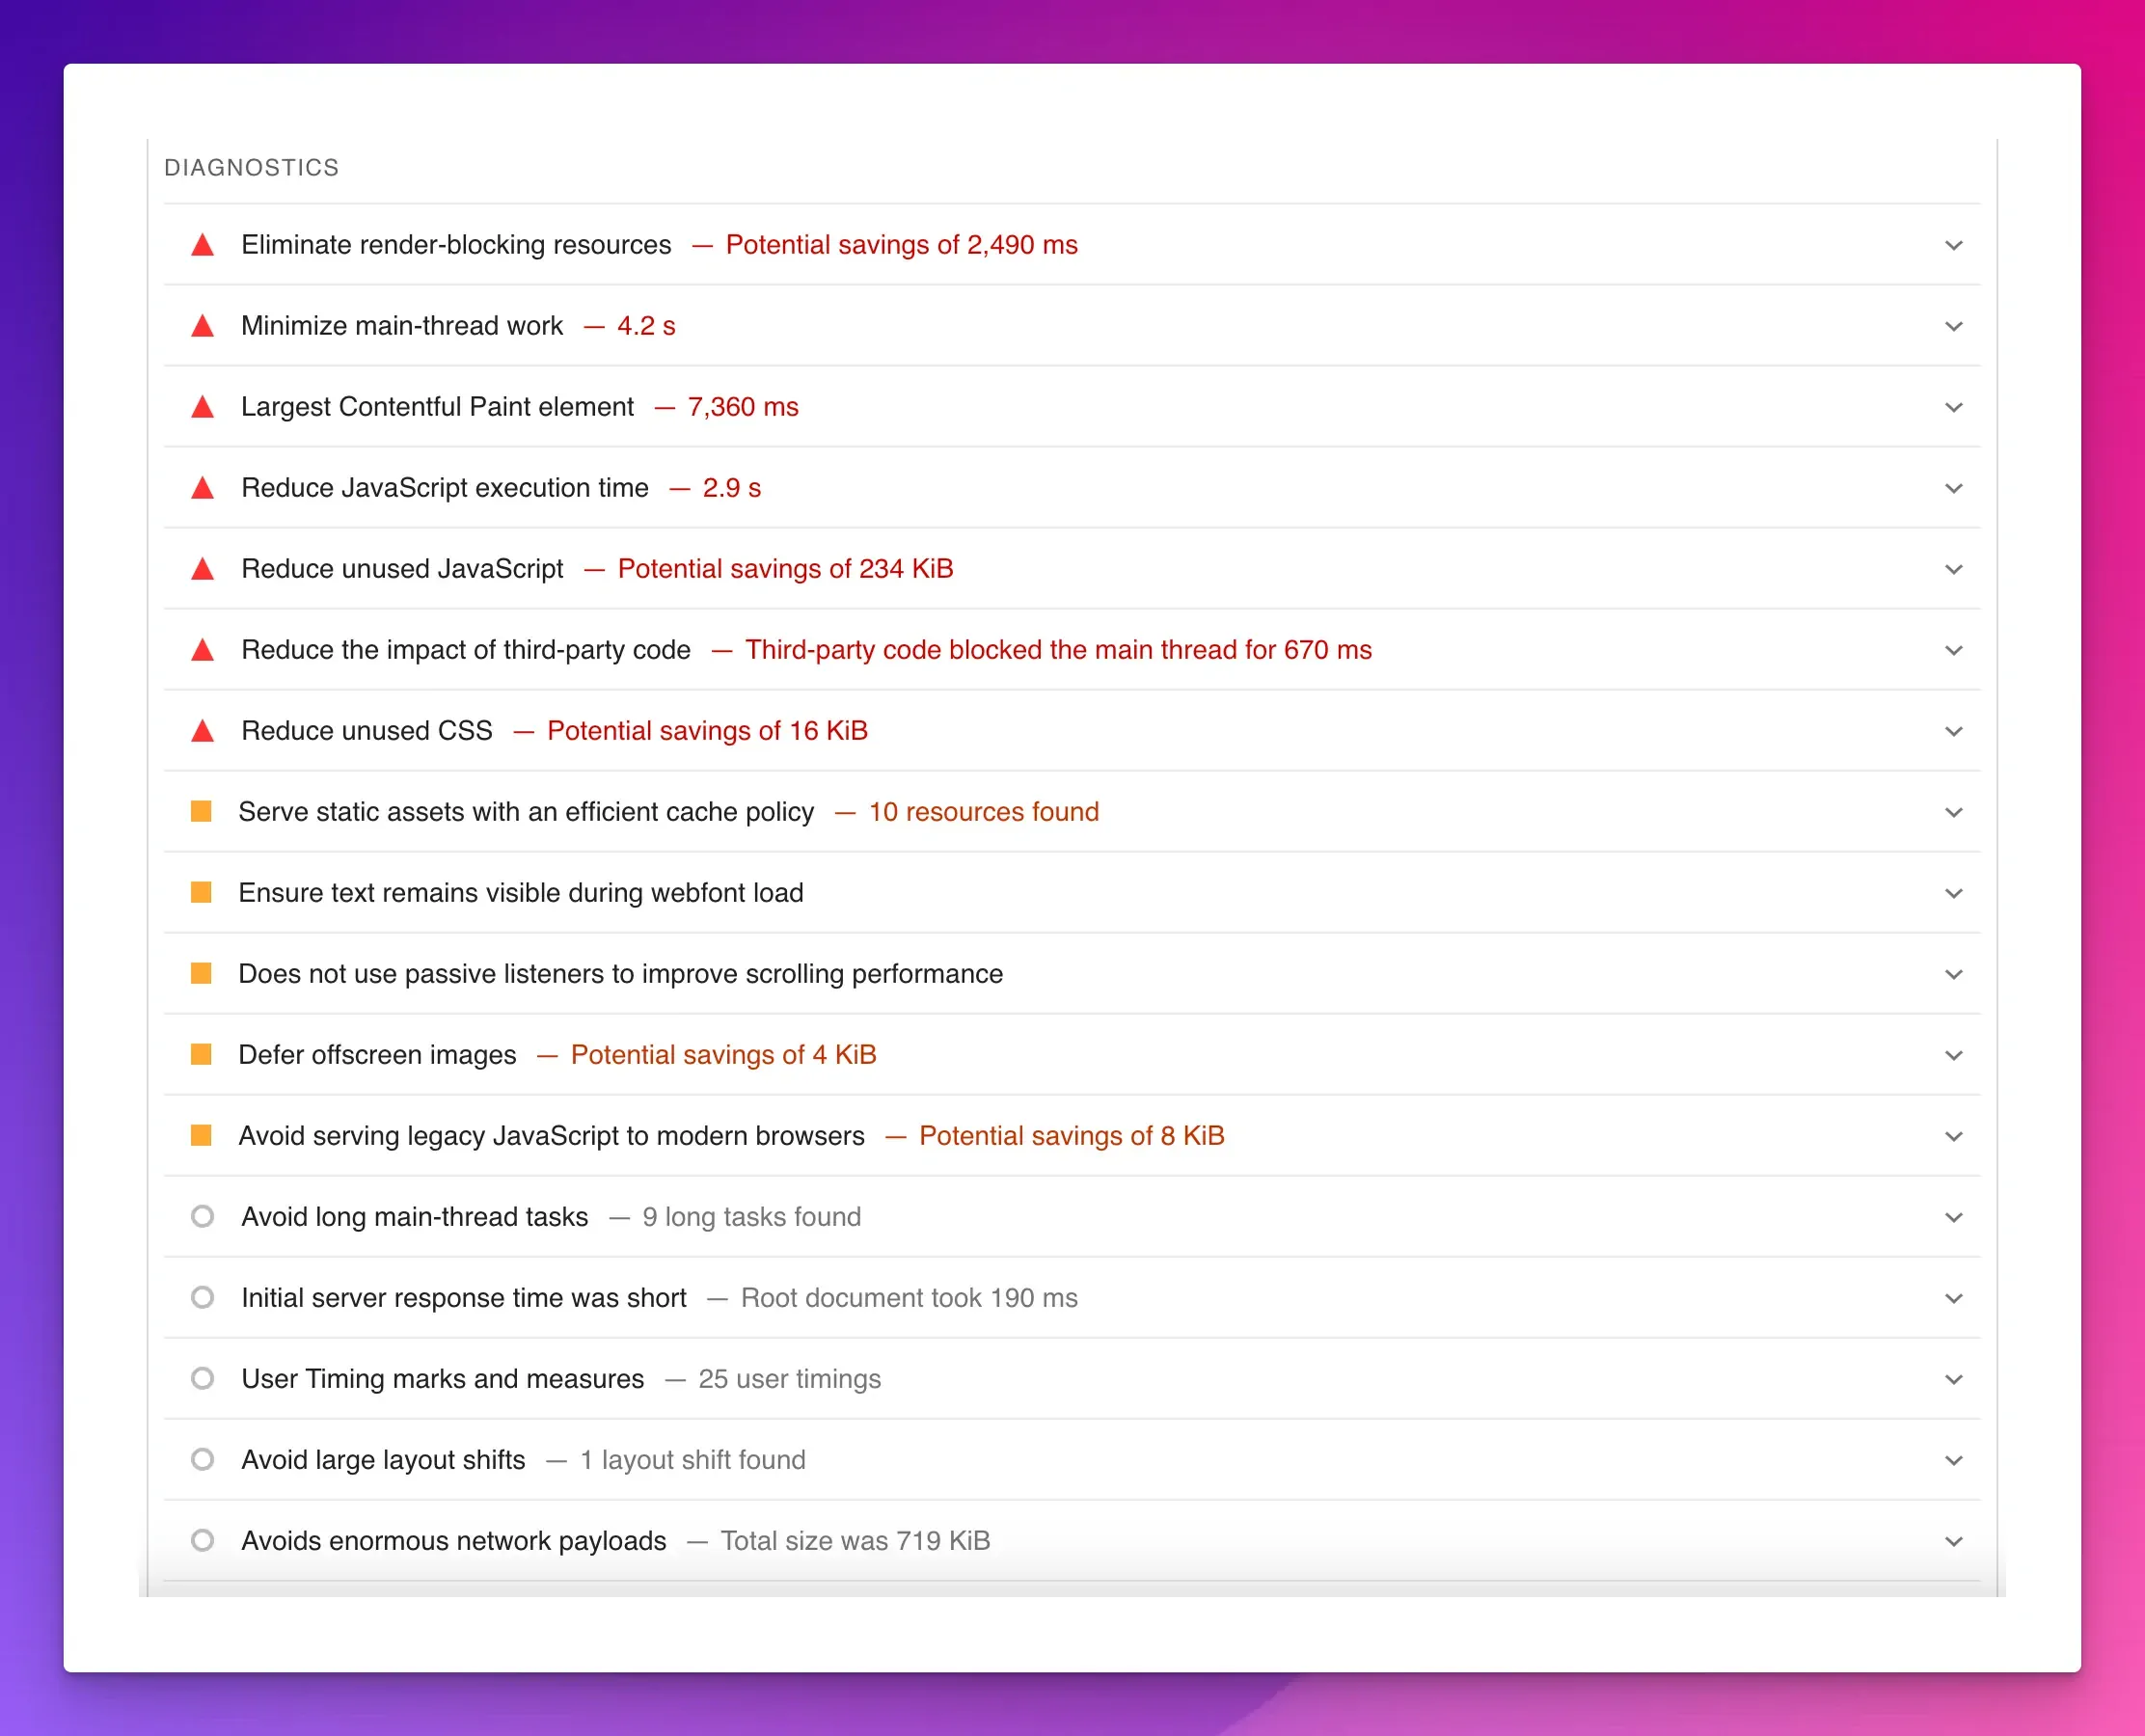
Now that you’re familiar with using PSI, let’s dive into some other common performance warnings and how to address them:
Minimize Main-thread Work:
- Problem: The browser’s main thread gets blocked, leading to slow load times.
- Solution: Optimize JavaScript execution and reduce script parsing time.
Serve Images in Next-Gen Formats:
- Problem: Older image formats increase file sizes.
- Solution: Use modern formats like WebP for faster loading times.
Eliminate Render-Blocking Resources:
- Problem: CSS and JavaScript files delay rendering.
- Solution: Defer non-critical CSS and JS or use asynchronous loading.
Minify Resources:
- Problem: Unnecessarily large HTML, CSS, and JS files.
- Solution: Minify these resources to reduce their size.
Defer Offscreen Images:
- Problem: Loading all images at once slows down the initial page load.
- Solution: Implement lazy loading for images that are not immediately visible.
Serve Static Assets with Efficient Cache Policy:
- Problem: Frequent fetching of unchanged resources.
- Solution: Use caching strategies to store static assets locally.
Ensure Text Remains Visible During Webfont Load:
- Problem: Fonts blocking the rendering of visible text.
- Solution: Use font-display properties to ensure text remains visible.
Image Elements Lack Explicit Width and Height Attributes:
- Problem: Missing attributes cause layout shifts.
- Solution: Define width and height for all images to maintain layout stability.
Reduce the Impact of Third-party Code:
- Problem: Third-party scripts slow down page loading.
- Solution: Optimize or defer the loading of third-party scripts.
Final Words
Google PageSpeed Insights is an invaluable tool for any business owner looking to improve their website’s performance.
Understanding how to use PSI effectively, interpreting its reports, and addressing common performance issues can significantly enhance user experience and boost your site’s success.
Remember, achieving a perfect score isn’t necessary; focus on making meaningful improvements that enhance real-world user experiences.
Regularly revisit PSI to stay updated on Google’s recommendations and track your progress over time.
With these insights, you’re on your way to creating a fast, efficient, and user-friendly website that drives traffic and conversions.
To save time, you can hire a team of website professionals to help your business website get good scores.
FAQs
Why should I care about my website's speed?
A slow website can lead to higher bounce rates, lower conversions, and significant revenue losses.
How often should I check my PSI report?
It’s a good practice to regularly check your website’s performance, especially after significant changes or updates.
Can I achieve a perfect 100/100 score?
Yes, you can achieve a perfect 100/100 score in Google PageSpeed Insights by thoroughly optimizing your website’s performance. It includes improving server response times, optimizing images, and minimizing render-blocking resources.
Do I need technical knowledge to use PSI?
No, PSI is also designed for non-technical users. However, you might need a developer’s help implementing some of the advanced recommendations. You can get help from a website creation agency .